AuthorMike Reeves Fayette County TN. County Commissioner, District 6 Position 1 Archives
August 2025
Categories |
Back to Blog
Part 5 is the conclusion of the series on “Comparing School Financial and Academic Performance.” Here, information from the previous articles in the series will be summarized, and one final slide will punctuate the series. Consider the factors that come into play, as noted in the previous articles: Part 1: Provided a backdrop for comparing four school systems, Fayette, Hardeman, Henry, and Obion. It also summarized the findings of the analysis of those counties. Fayette County:
Part 2: Demonstrated that other counties pay teachers far more than FCPS, even though FCPS has the highest PPE (Per Pupil Expenditure). Other counties pay teachers a higher percentage of PPE per average class size (average number of pupils per class x PPE), that average being 35% while FCPS pays only 27%. Further, should FCPS pay 35% of PPE for average class size, classroom teachers would be paid more than $62,000. A note of interest, the average classroom teacher pay in Shelby County is $62,911. Part3: Showed the disparity between the percentage of budget spent on Instruction (all things classroom related) versus Support Services (administrative services not classroom related). FCPS spends nearly half of the budget on Support Services versus closer to 40% for the other county school systems. It also demonstrates the fact that Instruction and Support Services are inversely proportional. When more is spent on one, less is spent on the other. So as more is spent on Support Services, less is spent on Instruction. Part4: Provided a view of performance versus spending over 10 years, showing that as spending on Support Services increased, academic performance decreased. Using trend lines, it is apparent that over the next few years, Support Services spending will surpass that of Instruction. Further, academic performance over ten years experienced steady declined across most counties. The COVID year impacted performance of all counties, but other school systems academic performance picked up significantly the following year, while FCPS continued to decline. Based on information provided by the state, FCPS 3rd-8th Grade ELA is 18.4% which ranks at number 94 of 95 Counties. 3rd-8th Grade Math is 13.4% and ranks at number 93 of 95 counties. The composite of all educational considerations has prompted the State of Tennessee to rank FCPS as number 95 of 95 counties in the year 2023. In other words, for education, FCPS is the lowest ranked county in Tennessee. However, looking at the state data, 81 counties have lower Per Pupil Expenditure than FCPS, while only 16 counties have lower teacher pay than FCPS. This means that FCPS has more money available to pay teachers higher salaries than 81 counties, yet only 16 counties pay teachers less than FCPS. One may ask, “How can this be?” The answer lies in spending decisions. FCPS has chosen to spend more on Support Services and less on Instruction in the classroom. This has clear ramifications with regard to academic performance as reflected in the 2023 education ranking of FCPS as lowest in Tennessee. Based on counties with students and PPE, the chart, “Top Ten Support Services Spending as Percent of Budget - Most to Least,” shows the 10 counties that spend the highest percentage of their budget on Support Services. Number 1 is FCPS, which spends 49.2% of the budget on Support Services. Shelby County only spends 46.3%, a difference of 2.9%. Whereas, FCPS has the highest percentage of spending on Support Services, it also has the lowest rank in the state for education. The obvious question is, "Should more be spent on Instruction and less on Support Services?" The answer is just as obvious as the question! 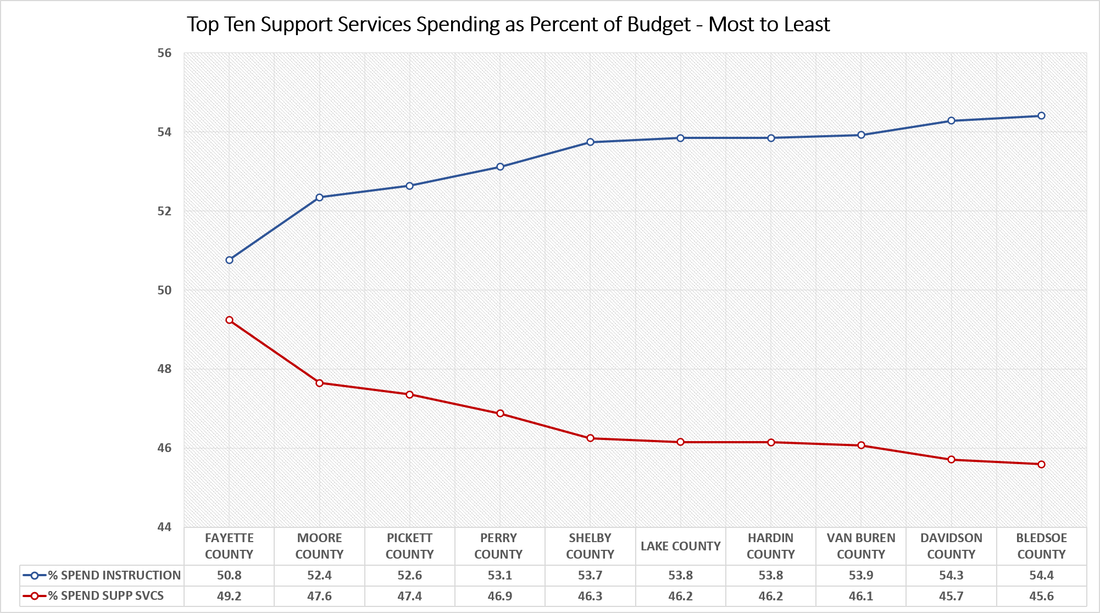
0 Comments
|

 RSS Feed