AuthorMike Reeves Fayette County TN. County Commissioner, District 6 Position 1 Archives
August 2025
Categories |
Back to Blog
In Part 3, a comparison of "Instruction" and "Support Services (Overhead)" spending demonstrated that FCPS spends a far higher percentage of the budget on "Support Services" than other County school systems of similar size and budget. Part 4 focuses on a ten-year pattern of spending as well as a comparison of academic performance over that time, including COVID. The chart "Percent Spending Instruction vs Support Services and 3rd Grade RLA/ELA Results" shows trends for spending on teachers and classroom "Instruction" versus other, non-classroom related, "Support Services." The spending lines are complemented by a 3rd Grade RLA/ELA trend over ten years. It is easy to see downward trending in scores as the percentage of spending on Support Services increased and that of Instruction decreased. While it appears that COVID did have some impact on the scores, the overall trend was already going in a negative direction as Support Services spending moved upward. In 2016, there was a transition from RLA (Reading/Language Arts) to ELA (English Language Arts). The 2016 data shows "suppressed" in the state database and no 3rd Grade data is available. Because of school closures in 2020, no data is available for 2020. Viewing the linear trend lines (dashed red lines) in the chart, in 2013 when spending was fifty-five percent Instruction and forty-five percent Support Services, 3rd Grade RLA scores were significantly higher. As the percentage of spending on Instruction decreased, scores began to sink lower. In 2017, following the change from RLA to ELA, scores plummeted. However, at the same time, Support Services spending moved up to forty-eight percent while Instruction spending moved down to fifty-two percent. Spending fluctuated in 2020 and 2021, but in 2022 it reached fifty-one percent Instruction and forty-nine percent Support Services. The 2023 spending data is not yet available so that information cannot be shown at this time. In 2023, FCPS was ranked #94 out of 95 counties in 3rd-8th Reading and the composite of all factors resulted in a Fayette County rank of #95 of 95 counties for Education in the Tennessee "2023 County Profiles." 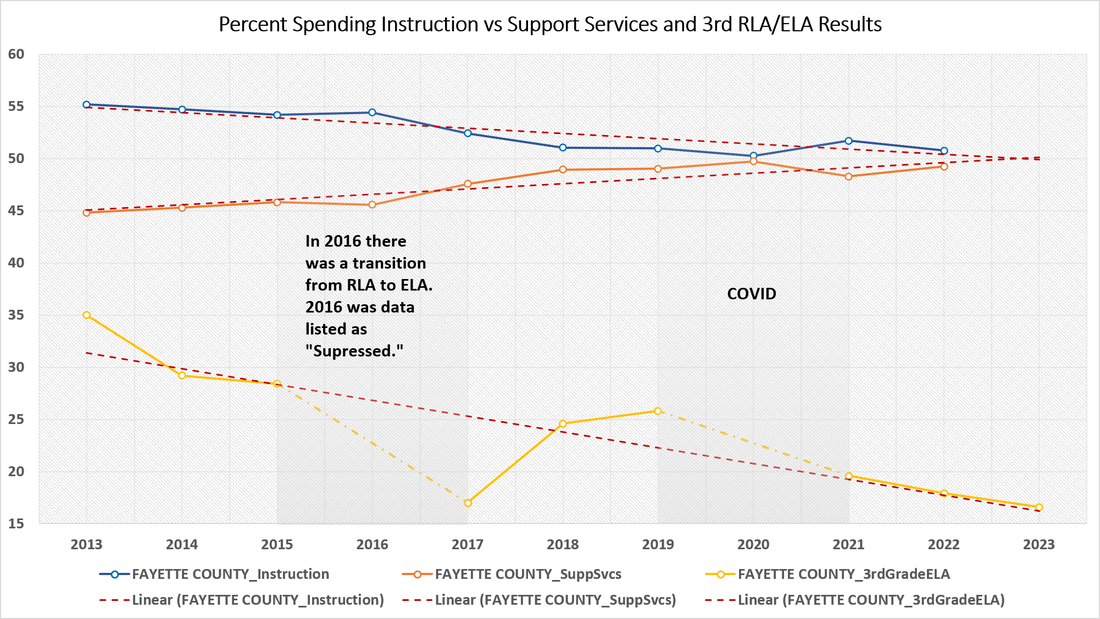 The following chart, "3rd Grade ELA Results over 10 Years," shows how all the Counties in the study have performed over the past ten years. This includes a transition from RLA to ELA in 2016 and COVID in 2020. There are some important points to note:
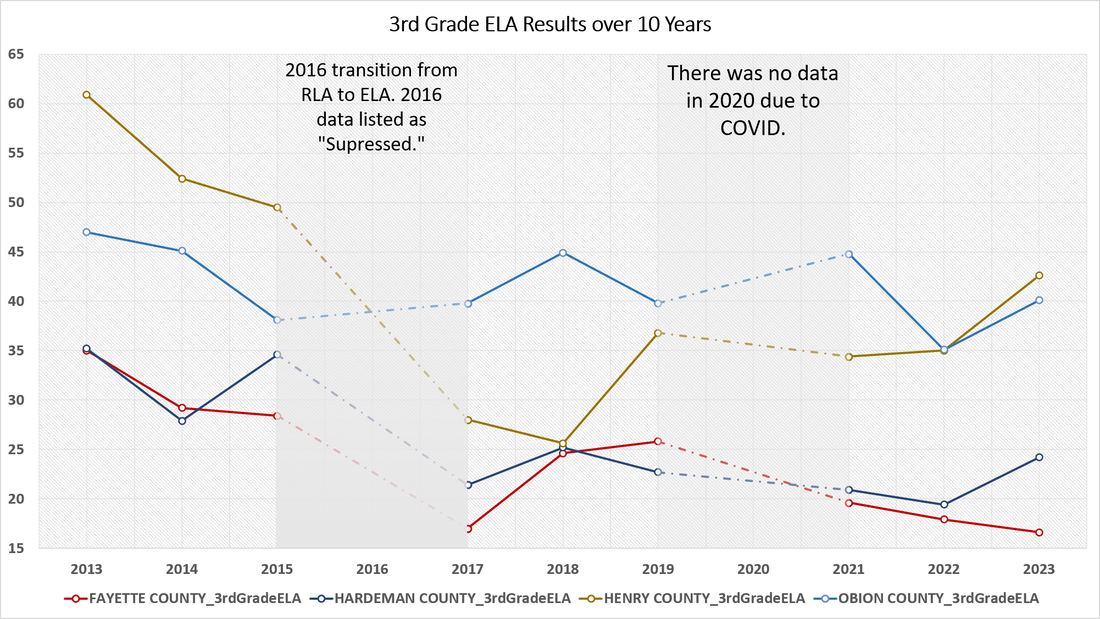 It is important to note the marked improvement of all counties in 2023 except for FCPS. Even considering the redo, apart from whether a redo was done in other counties, FPCS still has the lowest 3rd Grade ELA scores.
An important consideration is that FCPS spends significantly more on Support Services and less on Instruction as a percentage of the budget when compared to other counties. This translates to lower teacher pay, which makes it difficult to hire and retain good teachers. Consequently, this is likely an important factor in the state of Tennessee’s current ranking of FCPS as #95 of 95 county school systems in Tennessee.
0 Comments
Back to Blog
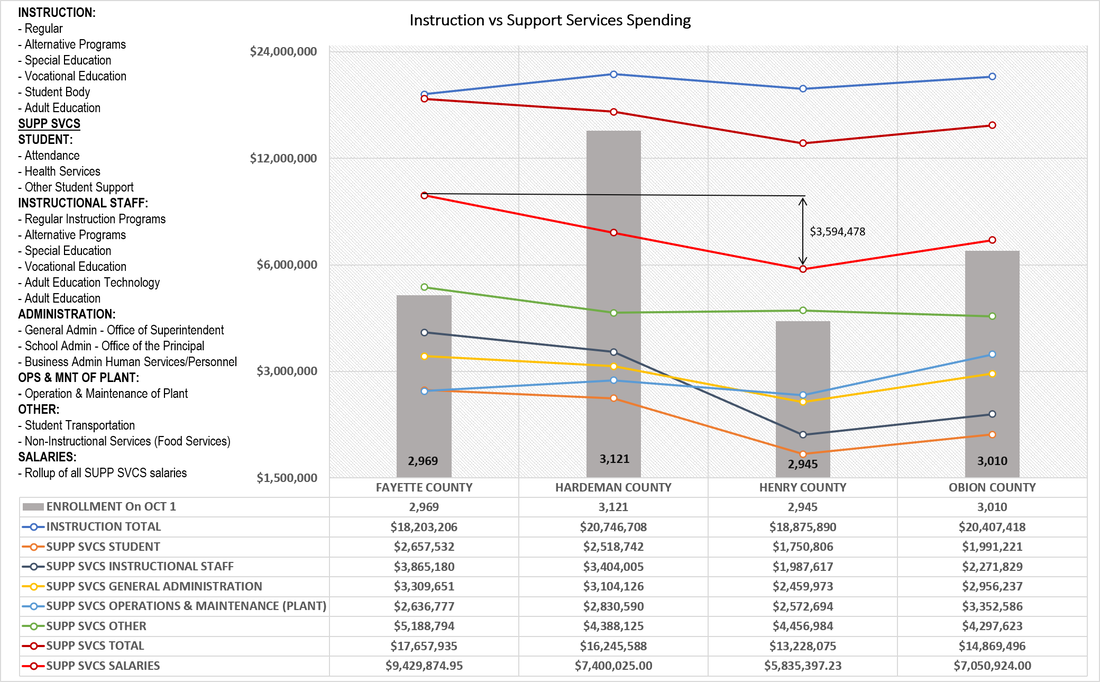
"Part 3" covers how money is spent on "Instruction" versus "Support Services." In general, "Instruction" is classroom-related spending such as teachers, materials, and textbooks, while "Support Services" can be viewed, to some degree, as administrative overhead. Although there are some aspects of "Support Services" which provide necessary services, like Operations and Maintenance of the Plant (Facilities), Transportation, Health, and Food Services. In addition, there are some "Support Services" administrative functions which are required as well. The first chart, "Instruction vs Support Services Spending," covers the overall spending for the counties. The column on the left of the chart shows the categories of spending included in each of the "INSTRUCTION" and "SUPP SVCS" items the TDOE rolled into the "Total Current Expenditures (Table 50 ***)" spreadsheet. While the chart is somewhat busy, there are some key takeaways:
 One of the spending categories which stands out is "SUPP SVCS OTHER." One significantly disparate component is "Student Transportation." The chart "Support Services Transportation Buses and Personnel vs Cost" shows how much counties spend on Student Transportation. "TRANSPORTATION TOTAL (grey line)," the total of all transportation items which shows that FCPS spends between $768,707 and $996,750 more than other counties. Even though Fayette County covers more square miles, all of the counties in the study spend similar amounts on "FUEL AND LUBRICANTS (green line)." There is some variance in "PARTS, OTHER MATERIALS & EQUIPMENT (blue line)," but those differences can be attributed to the age and number of buses in the counties. However, there is a large disparity in the number of "TRANSPORTATION PERSONNEL (light blue bar)" as well as "SALARIES SUPERVISORS/DIRECTORS and OTHER (dark red line)." Hardeman County has 105 buses and 57 transportation personnel, while FCPS has 53 buses and 78 transportation personnel. The salary differential between Hardeman and FCPS is $517,066. Even more striking is the difference compared with Henry County, the most similar in size and budget, which has 92 buses and 40 transportation personnel. The transportation salaries in Henry County are $664,915 less than FCPS. One other area that seems incongruent is "OTHER (orange line)." FCPS spent $206,802, but the spending across other counties was between $34,847 and $41,018. While these are not large numbers, it is statistically unusual and, when coupled with the extraordinary spending in personnel salaries, the difference is noteworthy and warrants further review. In addition, though FCPS has 78 transportation personnel and 53 buses, there are students that must catch a bus at 5:27 AM. Even worse, they must endure a 1 ½ hour bus ride to and from school. One and one half (1 ½ ) hours is the limit according to Tennessee state law (TCA 49-6-2105 Maximum time in transit). The need to get up early enough to catch a bus at 5:27 AM in conjunction with the length of time on the bus has clear implications with regard to mental acuity and, consequently, academic performance. This is also worthy of additional scrutiny. 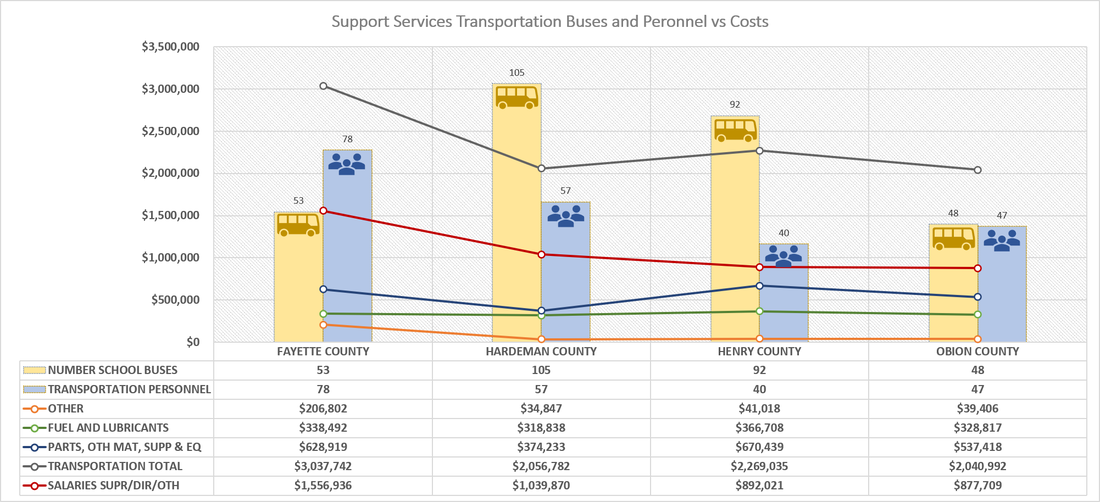 In "Part 4", it will shown that there is a correlation between lower 3rd Grade ELA scores and higher "Support Services" spending.
*** - https://www.tn.gov/education/districts/federal-programs-and-oversight/data/department-reports/2022-annual-statistical-report.html |

 RSS Feed